![Symbol_transparent_black.png]](https://help.takeup.ai/hs-fs/hubfs/Symbol_transparent_black.png?height=50&name=Symbol_transparent_black.png)
The Booking Window section of your TakeUp Dashboard helps you understand when your guests are making their reservations. Instead of just telling you how many rooms are booked, this view shows you how far in advance people are booking for each future month.
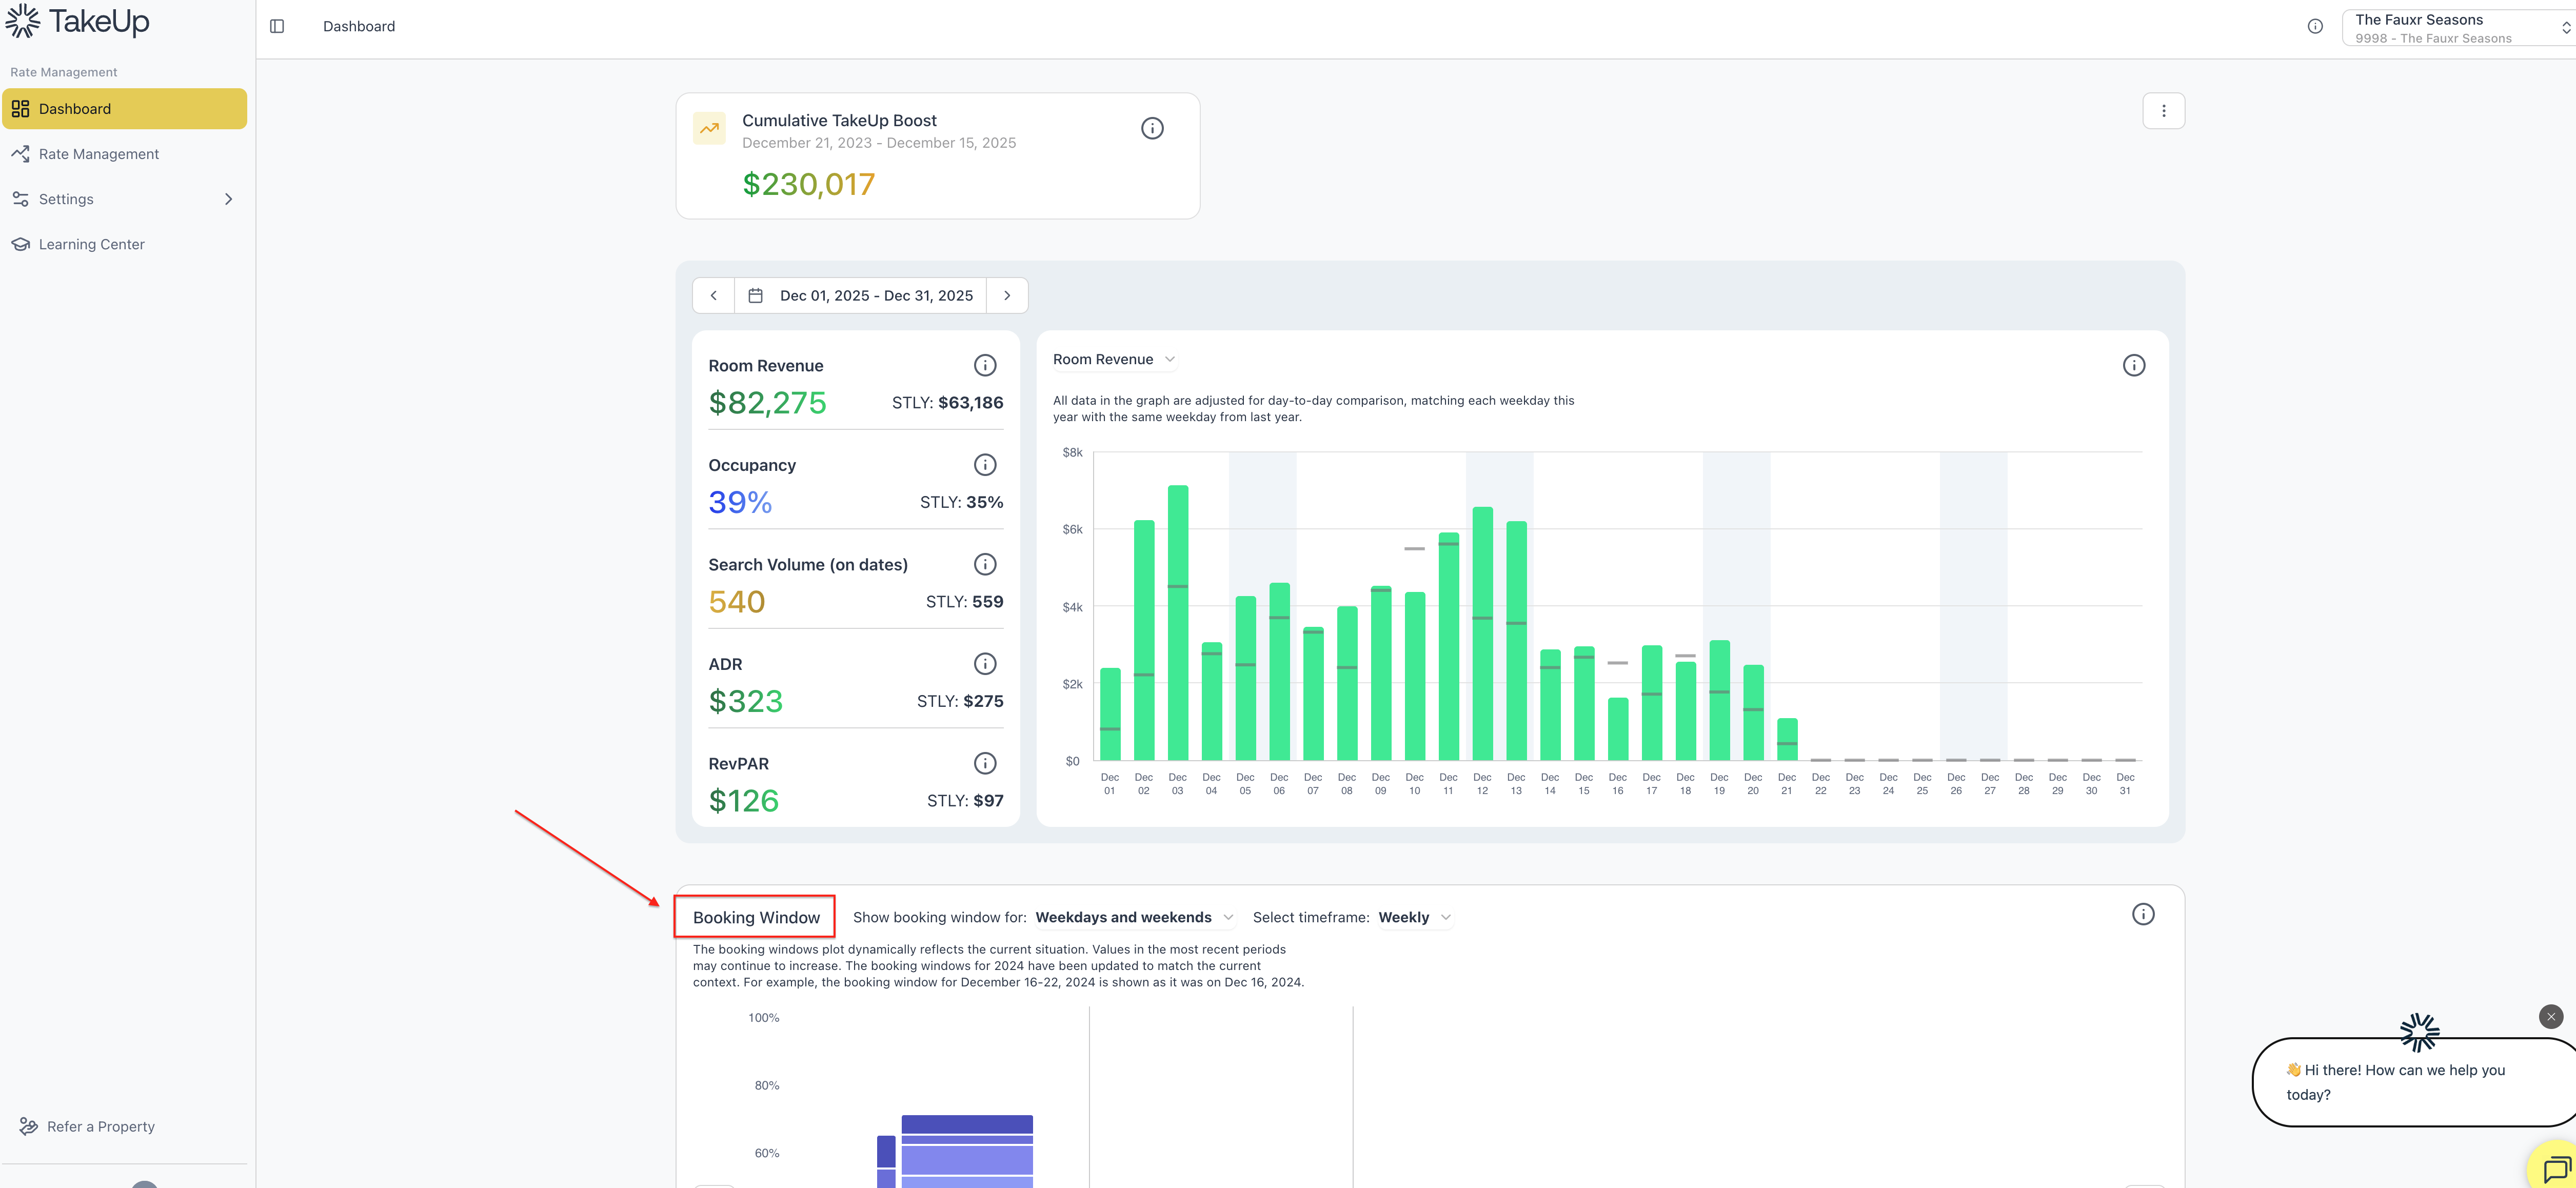
TakeUp displays this using a layered bar chart that breaks bookings into time slices, including:
- 0 to 3 days out
- 4 to 7 days out
- 8 to 14 days out
- 15 to 30 days out
- 31 to 60 days out
- 61 to 90 days out
- 91 to 180 days out
- 181+ days out
These time windows stack together to show you the full story of how early or late guests tend to commit.
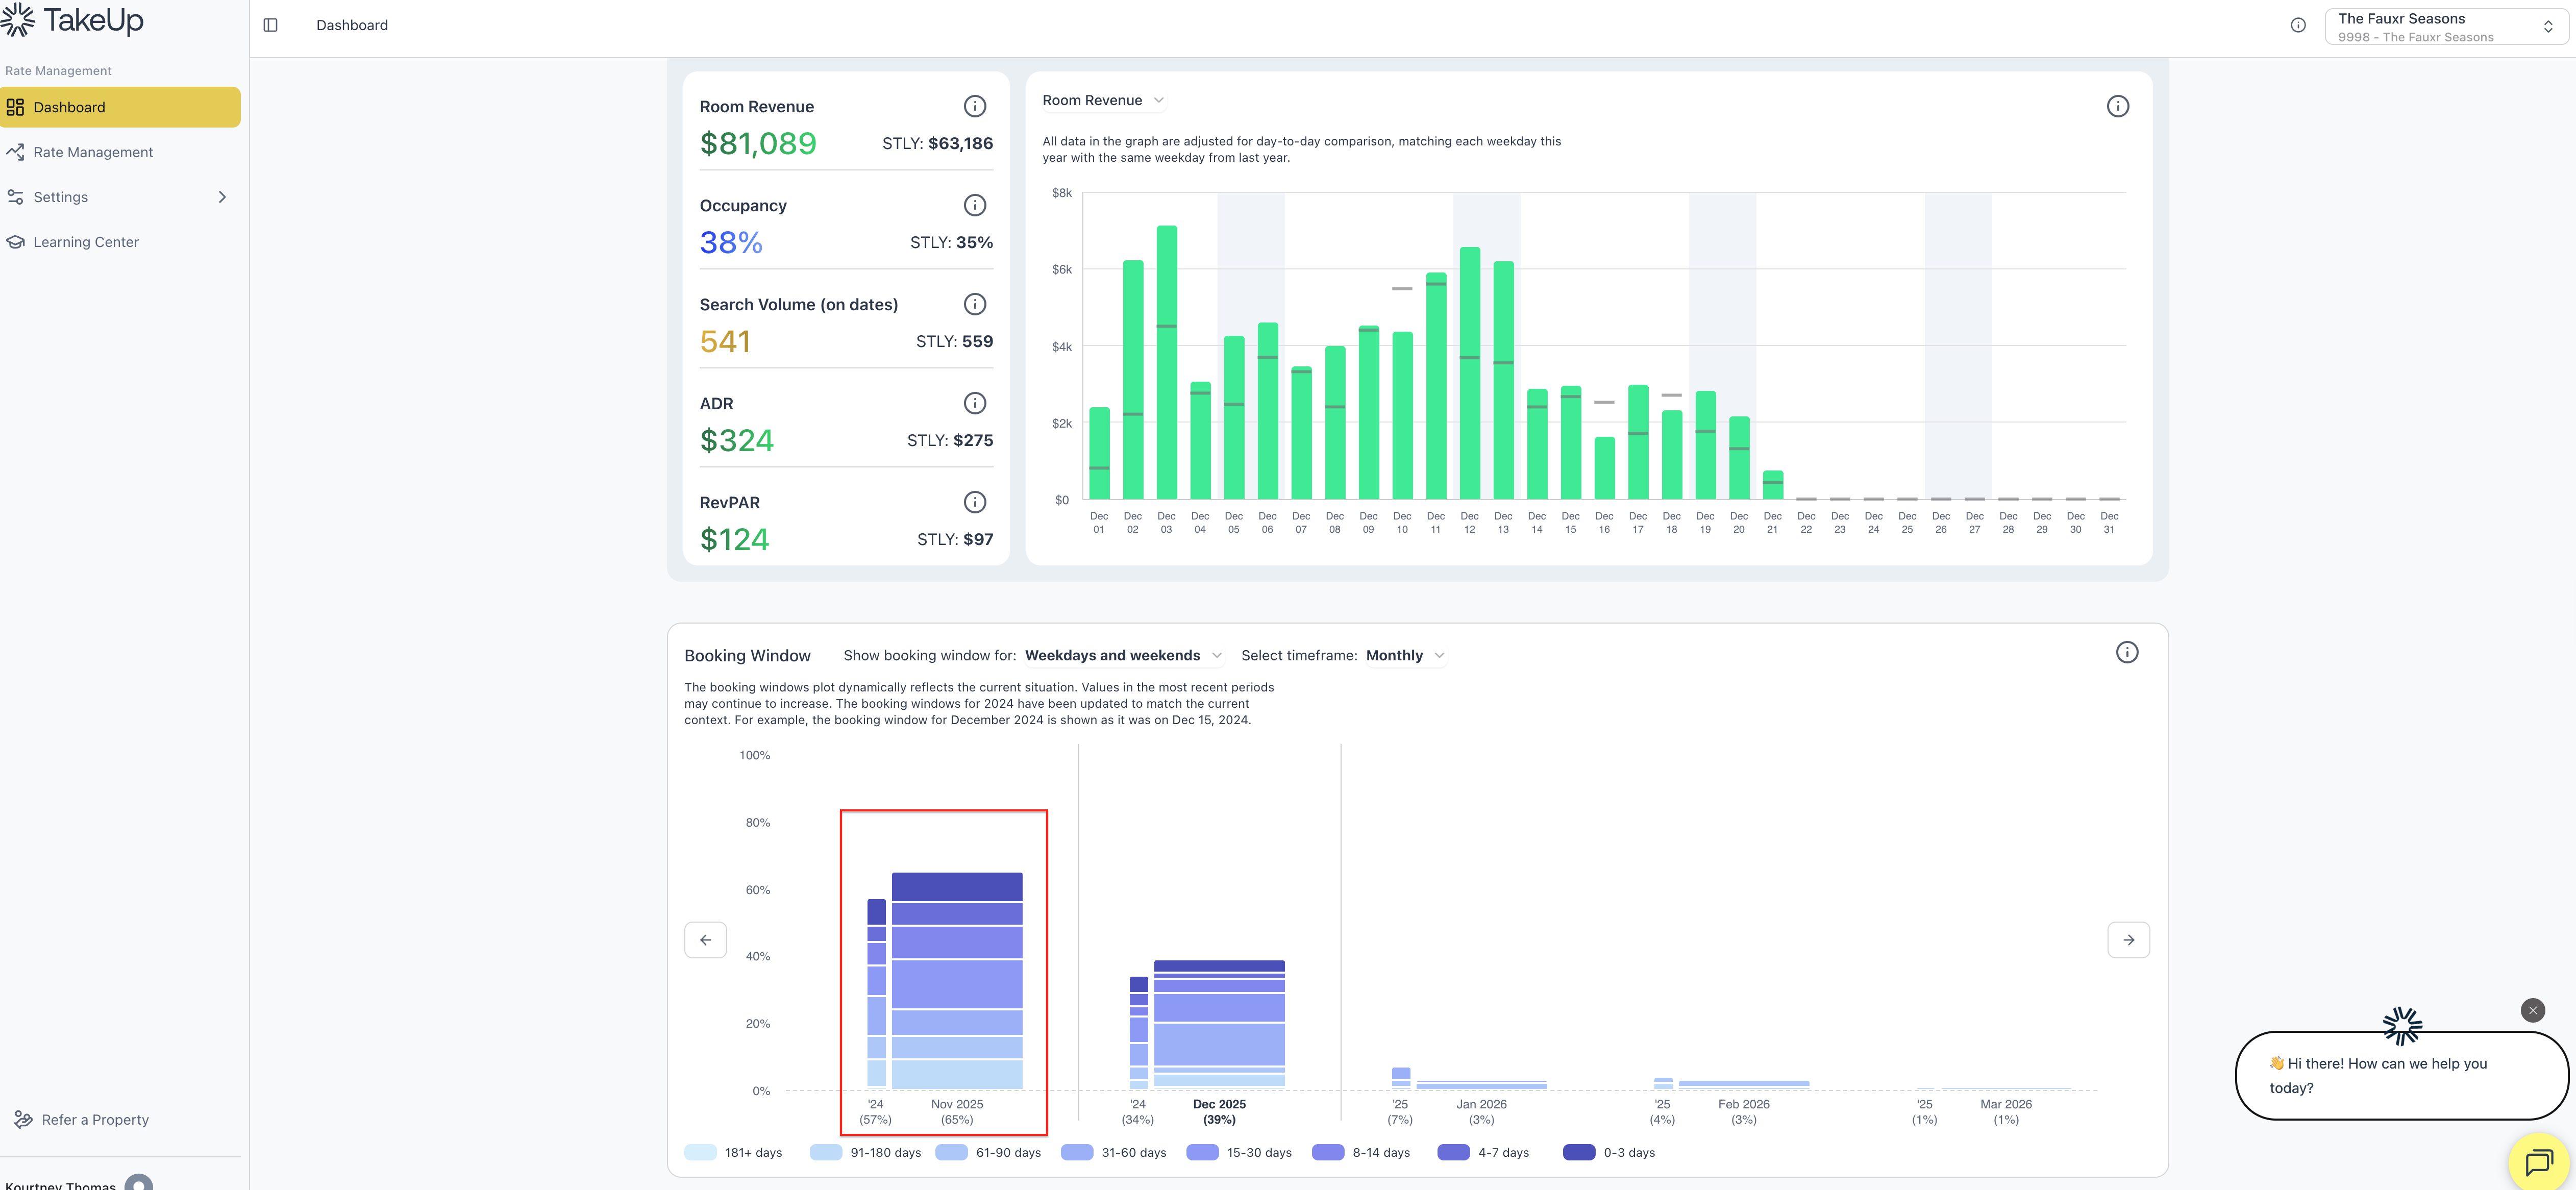
Reading the TakeUp Booking Window Chart
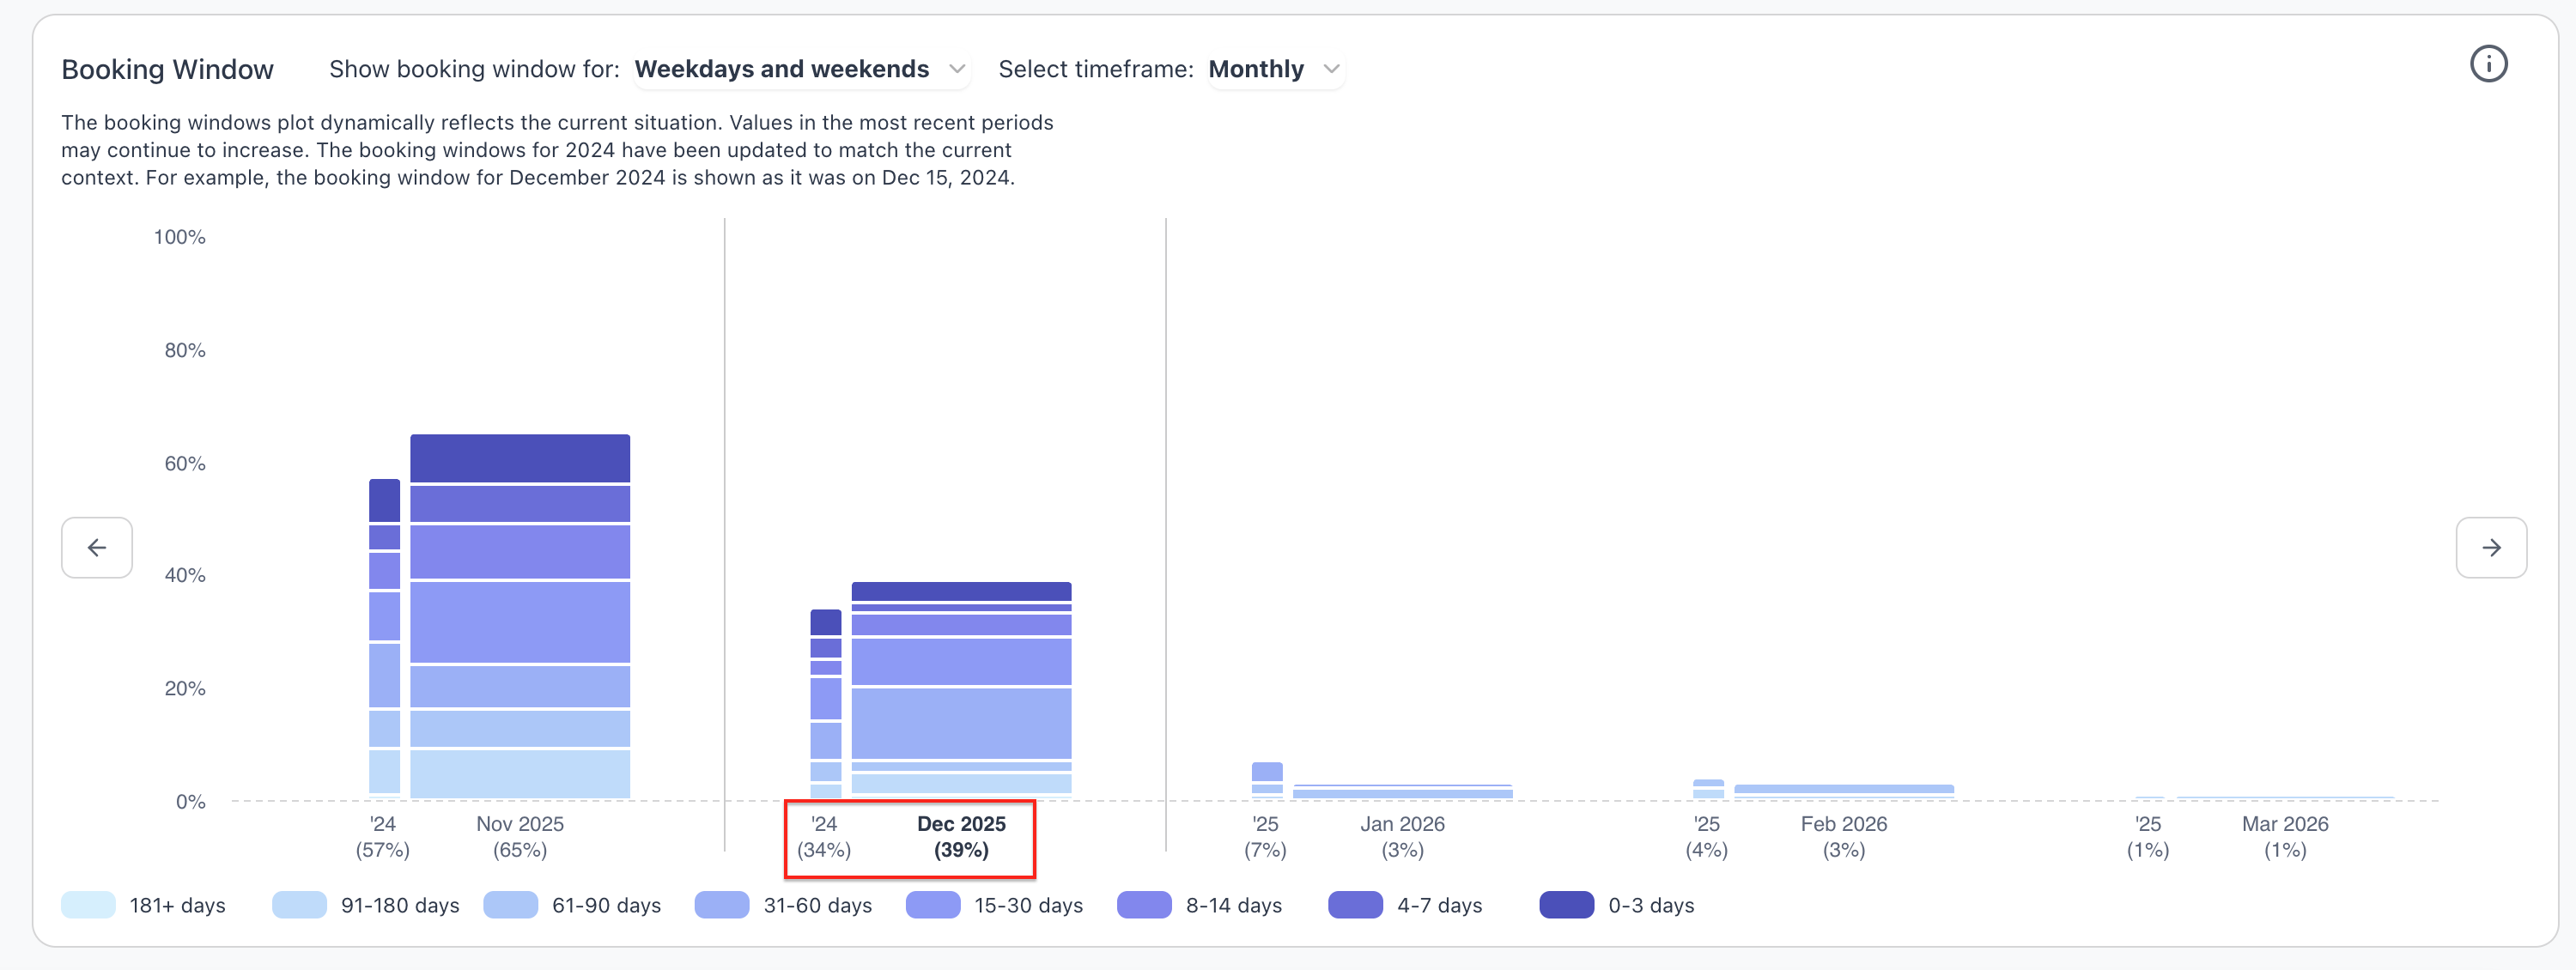
Each tall column on the chart represents a month in the future. Inside each column, the blocks represent the share of reservations that came in during each booking window. The darker the shade, the closer the guest booked to their stay date.
For example:
- A large light blue section means many guests booked far in advance
- A larger darker section means most bookings happened last minute
This helps you instantly understand booking behavior.
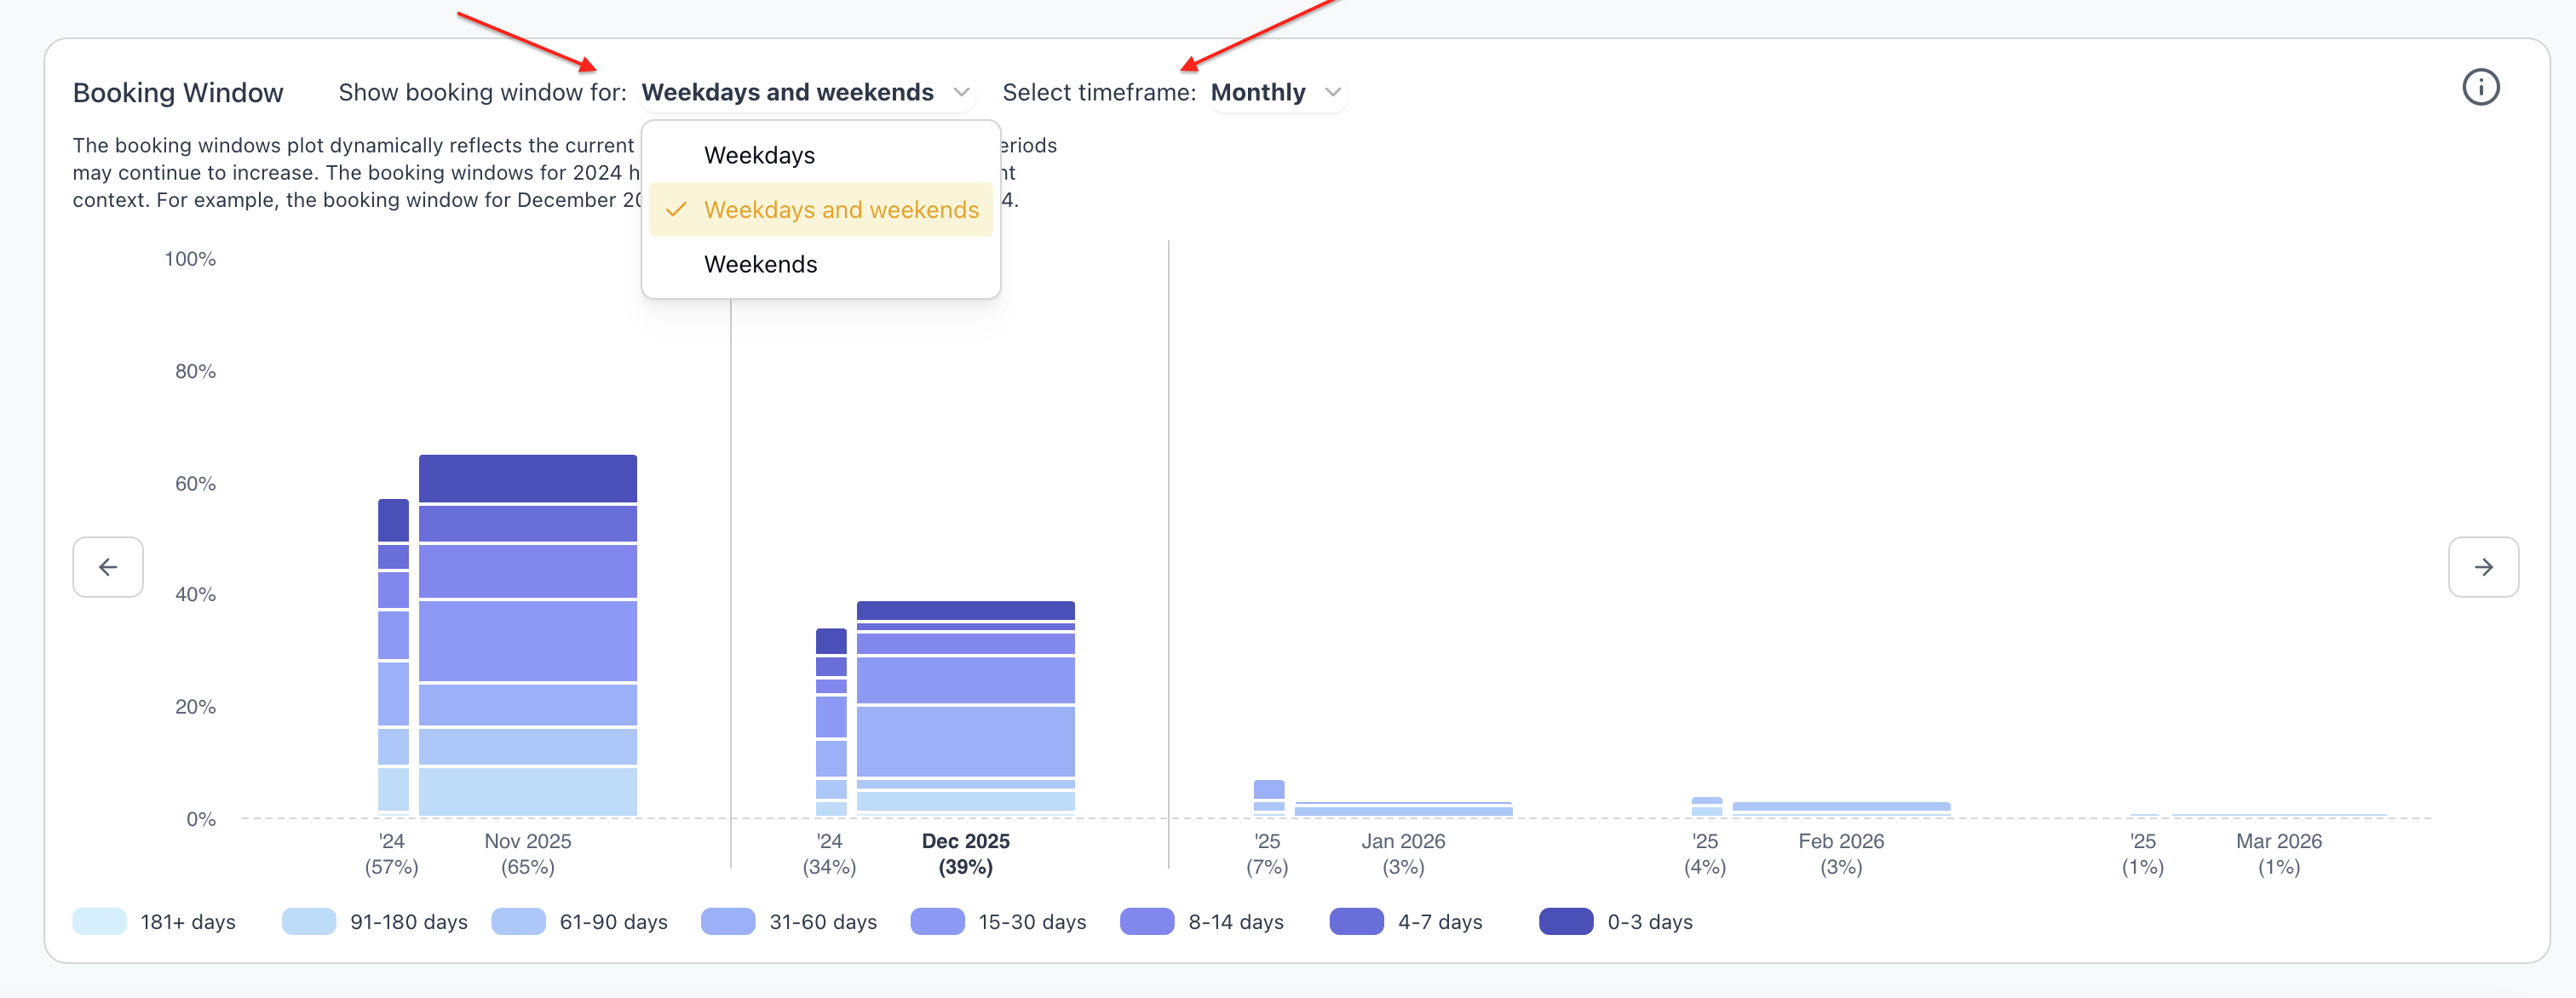
At the top, you can adjust the view to show:
- Weekdays and weekends combined
- Weekdays only
- Weekends only
This lets you compare data at a more granular level, including, for instance, business travel patterns versus leisure patterns. Often weekends book later, while business travel books earlier, and TakeUp allows you to see both clearly.
The timeframe selector gives you flexibility to view booking windows on a weekly, biweekly, monthly, or quarterly basis. Choosing monthly keeps things simple and easy for most users.
Understanding the Percentages
At the bottom of each month, you will see an occupancy percentage. This shows how full that month is currently, as well as a comparison to last year.
When you hover over a block within the bar, you will see a pop-up information window with more detailed information, including:
- The booking window range
- Your occupancy for that month
- Your ADR for that month
- Last year’s occupancy and ADR for the same window
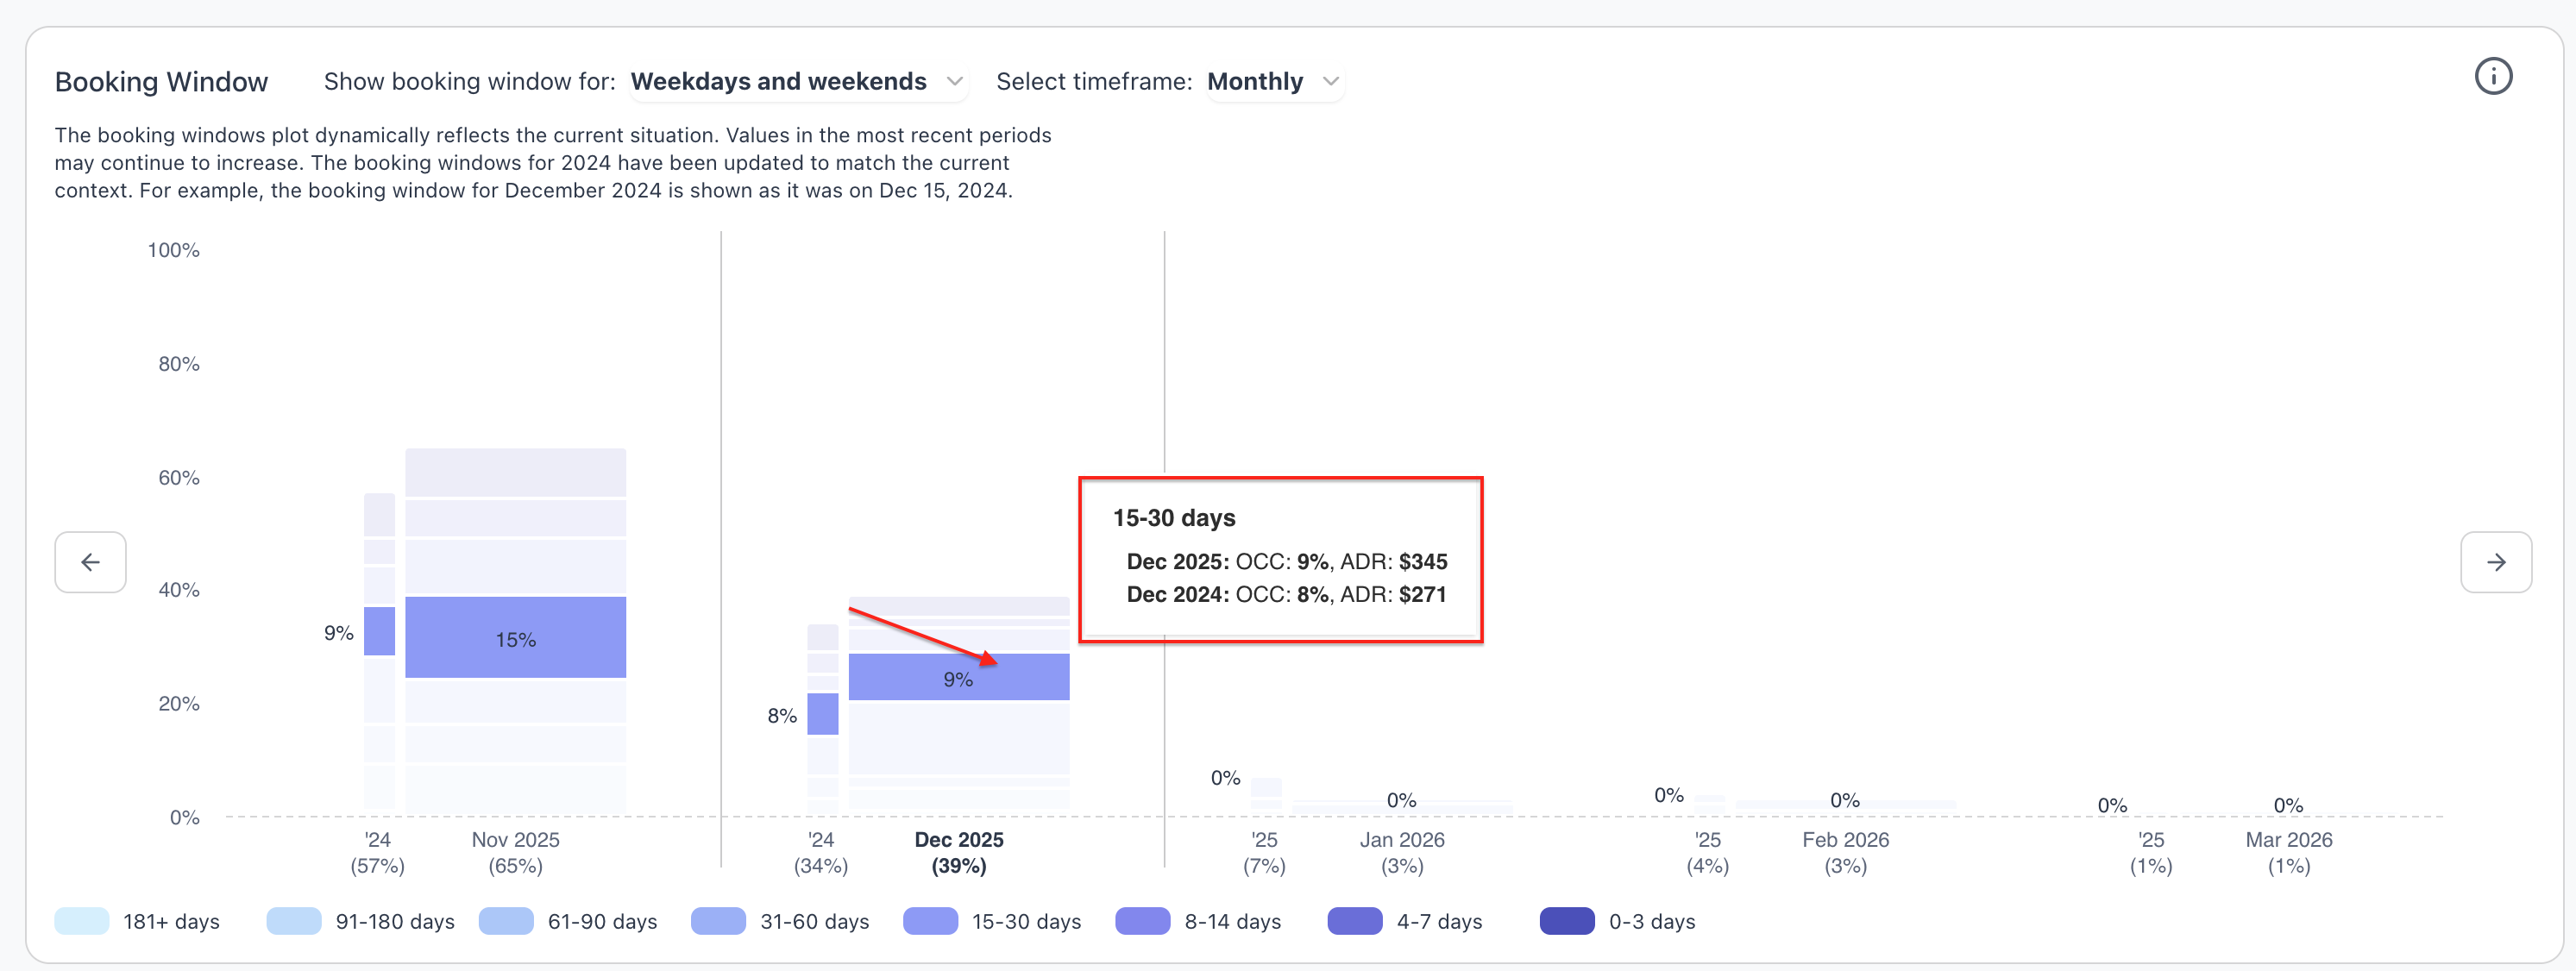
This makes it easy to compare not only pacing but price strength at each stage.
What the Chart Tells You
This chart helps answer important questions such as:
- How early do guests normally book for each month
- Is the current year booking earlier or later than last year
- Are guests booking far out or waiting until the last minute
- How strong is demand at each stage of the booking curve
- Does ADR or occupancy shift depending on how early guests commit
These insights help you set better expectations and make smarter pricing decisions.
Example
If you hover over the “91 to 180 days” block for December 2025, you may see:
- Occupancy: 2%, ADR $476
- Last year: Occupancy 30%, ADR $429
This tells you that guests booked earlier last year, but you are commanding a stronger rate this year.
How to Use This Information
Here is how managers typically rely on the booking window chart.
When guests are booking earlier than usual:
- You may be entering a strong demand period
- You can lean into higher rates or hold your price longer
When guests are booking much later:
- Demand might be more sensitive
- You may want to soften rate bounds, adjust deltas, or watch search volume
When the booking window shifts compared to last year:
- You can better prepare staffing, housekeeping, and inventory
- You can anticipate pick up surges instead of being surprised